February 20, 2016

What Say You, Market? (the 02/19/2016 Edition)


(Click to enlarge weekly chart of the S&P 500 Index as of yesterday's close)

Not much to say. Support above 1800 for the S&P 500 Index is still holding on a weekly basis (the index closed at 1917). The major resistance above is around 1950 reached 02/01. (To be updated as needed).

February 11, 2016

Update

The S&P is again testing support. If it breaks (this week's close will be key), the Bears will have won and my previous analyses will be good for the dust bin. Today's and tomorrow's sessions should be interesting, to say the least. 1800 is the key level of support for the       S & P 500.

I'll have a more in-depth analysis this weekend.

Trade very very carefully as volatility is reflecting panicky sentiment.

February 10, 2016

What Say You, Market? (the 02/10/2016 Edition)


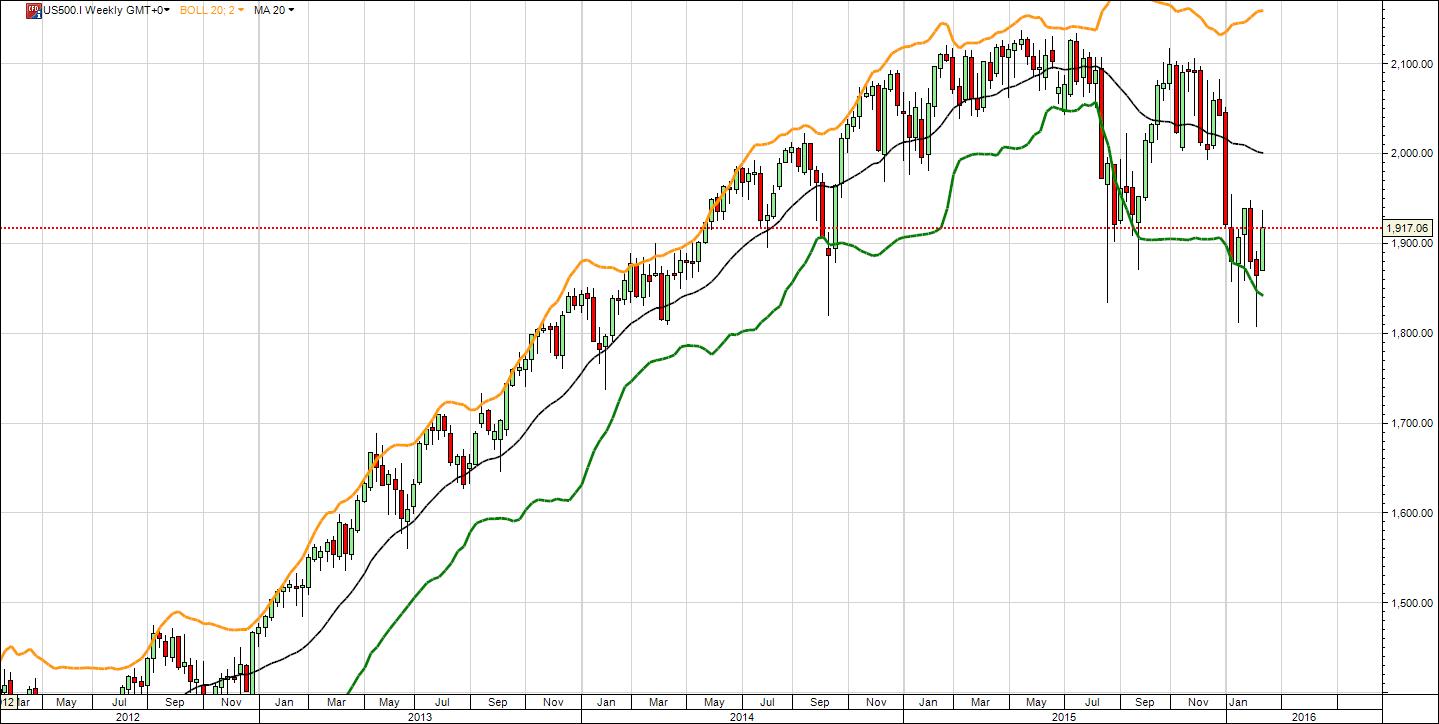
It looks like the 1810-1830 support band for the S&P 500 has been tested successfully again.
That's the 5th time since April 2014, which reinforces it as support. The Bears have to decisively pierce this 1800-ish support level to have their views vindicated. The onus is on them.
Granted the Bulls have a lot of resistance levels above too (More on this in future posts), but don't let yourself be scared out of your long-term investments by the voices of doom. They're always loudest near significant bottoms.
To add meat to my analysis, I'll make a probabilistic prediction (which should be the only kind of prediction when it comes to markets, as they are dynamic and chaotic): I give the S&P 500 a 65% chance of rebounding from here.
I will of course update this as more data becomes available.
Make sure to do your own due diligence before trading in these treacherous times.

Don't forget that Technical Analysis is a great descriptive tool of the markets but NOT a great predictive tool in the deterministic sense. What it allows you to do in the predictive realm is assign probablities to various scenarios. Markets are never 100% predictable. 

But if a technique allows you to give a given scenario a 70% chance of happening (for example), I say it's a pretty useful one.

February 7, 2016

What Say You, Market? (the 02/07/2016 Edition)


(Click chart above to enlarge: S&P 500 Monthly chart August 1998 - February 8, 2016)

Many market observers have been calling for an impending and imminent stock market crash similar to the ones of 2000-2003 and 2007-2009, They may or may not turn out to be right. Personally, I would give that scenario - i.e. at least a 50% decline of the market from its high - only a 15% chance of happening this year.

Why? Among other things, I see strong support a bit above the 1800 level for the S&P 500 Index (which closed at 1880 this week). That support was tested successfully 4 times: in March 2014, September 2015, July 2015 and more recently in January 2016.

Below that, there is formidable support at around 1600 which was the high reached at the end of the two previous cyclical Bull markets in 2000 and 2007.

I would advise all traders and investors to do their own due diligence before executing any trades. 

Trading can be very dangerous to your financial health.

(to be updated and enriched as more data becomes available)