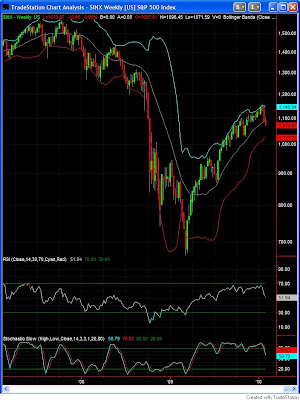
 In this time of relative market turmoil, I wanted to step back and take a look at the long-term technical picture. This is the weekly chart for the S&P 500 Index (click to enlarge) with the usual accoutrement: Bollinger Bands centered around the 20-week moving average, 14-week RSI and Slow Stochastics. I purposely left volume out so we can concentrate on pure price.
 The 20-week moving average is pretty significant here because it has basically acted as support to the stock market rally since last April. And the fact is that the 20-week moving average was broken this past week in a pretty decisive manner. Does it mean the rally is over? Let's just say it is compromised and the market will have a lot to prove over the next few days/weeks to show otherwise. To begin with, it would have to overtake our old friend the 20-week moving average which, in a metamorphosis known to technicians and traders everywhere, is now presumably acting as resistance, sitting at 1,088 as of Friday. Even more significantly, the S&P 500 index would have to break decisively above 1,100, also looming large as resistance.
It goes without saying that the technical picture can change in a matter of days but the longer the index lingers under the two previously mentioned resistance levels, the more likely it would be that the bull market that has pissed off so many people (mostly people talking their book, but aren't we all, one way or another?) since last March has ended. Now, the end of a bull market does not necessarily mean the beginning of a bear market. We could very well enter a phase of range-bound, directionless trading which might be even more frustrating to more people than the previous phase. But isn't it what markets do?
1 comment:
There are 3 ways to view it:
1. If one believes the worst is over, and sees two up waves since March, then we are now in an intermediate correction with a third upswing to come.
2. If one believes the worst is over and sees three up waves since March, then we are in a major correction (the "double dip" scenario) which may continue for some time (but the market won't test the march lows).
3. If one believes the worst is to come then we have just seen a 3 wave correction in an overall bear market and we will go down alot further than in last March... (I don't think this scenario is very likely at the moment).
Soros apparently belives the markets will go sideways for a while (which I interperate as option 2).
Post a Comment