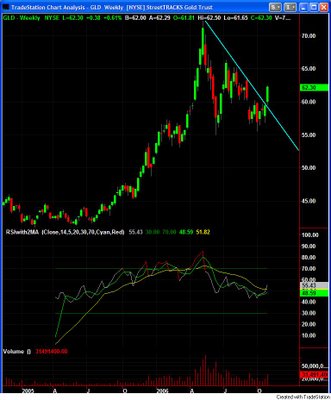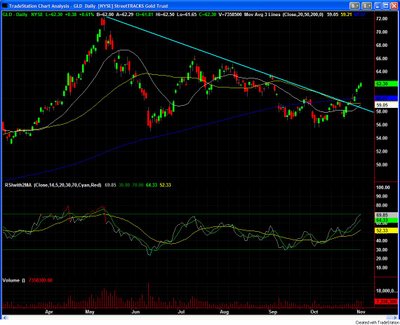
Ok, with a few more days under our belts since last entry, it is now safe to assume the GLD move was not a false breakout. GLD not only stayed above that resistance falling trendline but kept inching up as one can gather from studying the two charts above, respectively the daily and weekly GLD charts as of today's close.
(To have a better look at the charts, click on them twice)
On the weekly, it is also clear that the 14-day RSI bounced off the 40-50 band and crossed above both its 5- and 20-day moving averages as well as above 50. That 40-50 band is often a good spot for the RSI of a security in the midst of a bull market (as GLD most decidedly is) to bounce off and signal another leg up.
The next test and a good spot around which to take partial profits would be the previous high of 66.42 reached on 7/14/06. I wouldn't bet against that level being merely a stepping stone to bigger and better things.
