I've been keeping a 'trading journal" for a couple of years now. I jot down trading ideas, some well documented, others less so. Sometimes, I digress and write about something else altogether. I started this journal mainly for the benefit of my CMT sponsors, to kind of show them my trading thought process. For those who have never heard of it, the Chartered Market Technician designation is given by the MTA (Market Technicians Association) and is usually associated with proficiency in Technical Analysis and financial markets analysis in general. To obtain the CMT, one must, on top of passing three fairly involved exams, have a least 3 years of professional experience using Technical Analysis and be sponsored by 3 CMTs who would base their recommendation on one's body of work. Why would an independant trader like me want such a designation? Well, because it's an excuse to learn more and frankly, they really are proficient.
To make a short story even longer, I kind of started enjoying this writing exercise and I guess the next step nowadays when one writes anything is to blog whatever it is that one is writing. It doesn't even have to be good or interesting, just blog it.
So here is the latest entry in my journal which will become this blog's first entry. It's a week old but it's a long term play so it shouldn't matter.
TLT, a fairly popular ETF, is basically a proxy for the 20 year treasury bond. It could be one of the contrarian plays of the year as very few people would recommend this trade on the long side. Fundamentally, it appears that the US economy might be slowing down a lot faster than anticipated, forcing the Fed to put a stop to its rate hiking campaign even as inflation paints an increasingly alarming picture. Should the economy make a hard lending, the Fed might have to start cutting rates before long, causing long-term rates to go down and consequently TLT to go up. At least that's my take on the fundamentals with the caveat that I am a technical trader. In my experience though, the technical picture always looks better with the proper fundamental background.
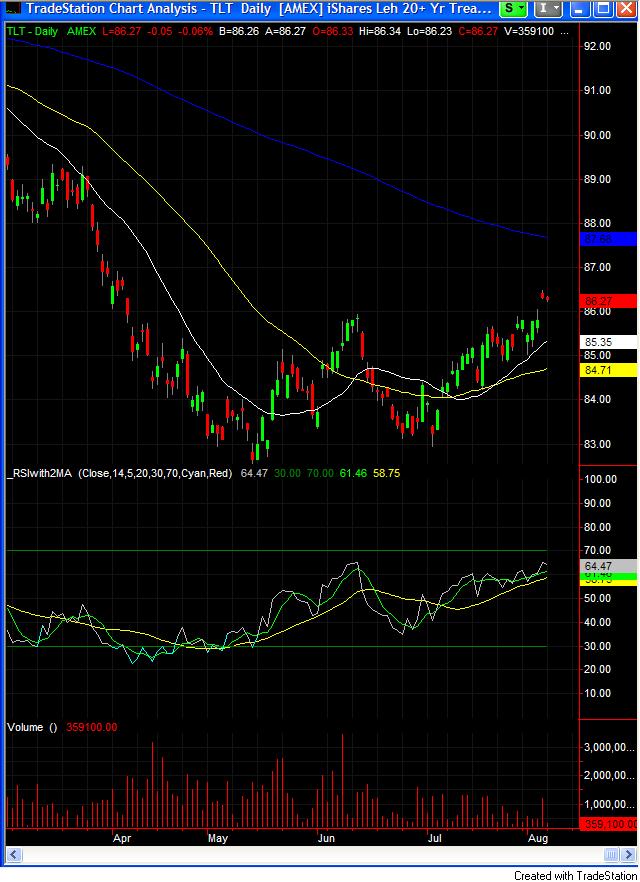
Technically, here's the daily chart for TLT as of 08/07/2006:
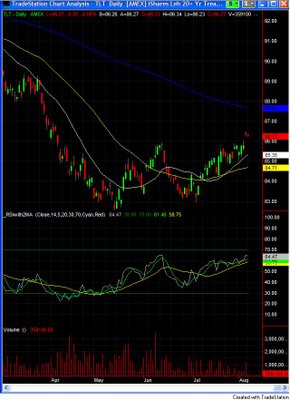
(Click on chart twice to enlarge)
As one can see, we are still technically in a long-term downtrend, with TLT trading below its 200-day simple moving average (blue line) which is itself downtrending. However, a few clues point out to a potential trend reversal. First, on 07/05/2006 TLT successfully tested its 05/12/2006 low of 82.56 by going down as low as 82.95 before rebounding and forming a doji. From that point on, we've been in a confirmed short-term uptrend, taking out the June high at around 86 in decisive manner (a gap above it on 08/04/2006 on higher than average volume). We could be witnessing the beginning of a long-term uptrend. A confirmation would be for TLT to move above and stay above its 200-day MA. Here at around 86.3 would be a good entry point for a trade betting on exactly that. With a trailing stop below the 50-day simple moving average (84.8 at this time) and an unlimited target for now, we would have a favorable risk/reward profile.
 Possibly a momentous day for GLD, the gold ETF.
