 I'm a little late to the party here but TLT did actually rebound off its 200-day Moving Average at around 87 as shown on the chart above (click to enlarge) and as envisioned in a previous blog entry. Now is it a real bounce en route to bigger better things (as in new highs above 91) or is it something else (how about the right shoulder of a Head and Shoulder formation), only time will tell. But it can't hurt to be long here with a clear exit point below 87.
February 8, 2007
I'm a little late to the party here but TLT did actually rebound off its 200-day Moving Average at around 87 as shown on the chart above (click to enlarge) and as envisioned in a previous blog entry. Now is it a real bounce en route to bigger better things (as in new highs above 91) or is it something else (how about the right shoulder of a Head and Shoulder formation), only time will tell. But it can't hurt to be long here with a clear exit point below 87.
February 1, 2007

As expected, USO did bottom out at 42.56 on 01/18/2007 and strongly rebounded from there. It’s up 5.50 dollars since I recommended buying it two weeks ago and it may be at or nearing the end of this particular move. In other words, taking profits at this level (a little below 49) would not be, in my humble opinion, a horribly ill-advised trade for the reasons presented below. It goes without saying that, should all the resistance levels be broken, re-entering the position is always an option. My reasons are as follows:
USO is getting close to that blue falling resistance line shown on the chart above (click to enlarge). It’s also closing in on previous support at around 50 (previous support often becomes resistance). The 14-day RSI is almost at its previous high of 60, the level it reached before USO's collapse. Finally, to add to the weight of evidence, the last few days of the rally have seen decreasing volume.
January 18, 2007

Nothing really new on the TLT and GLD front.
For a time, it looked like the alternate scenario (short term bearish) described in the previous post might come to pass but after a quick dip to 60, GLD is back to where it was. A decisive breakout above 64.55 is still needed for the strong bullish scenario to play out.
TLT is still hovering above support at 87 so no signal either way there.
One of my trading mentors used to often yell "Never try to catch a falling safe" while nervously pacing the trading floor. I've also heard it as "never try to catch a falling knife". Either way, the saying applies perfectly to USO, the oil ETF whose chart is shown above (click to enlarge).
With that wise advice in mind though, it seems to me that buying some USO here would constitute a low risk/ high reward play. The RSI is in oversold territory (around 20) and turning up. Today we tested yesterday's low below 43 before closing above 43 on humongous volume (volume the past few days has been about 5 times normal volume). Also, for those Japanese Candlesticks lovers out there, yesterday saw a bullish engulfing pattern.
All this to say that now would be a good time for USO to stage some type of rebound. Sentiment-wise, unless OPEC annouces a production increase I don't see how the news could get any worse at this point.
December 30, 2006

TLT, the 20+year treasury bond ETF, has suffered a severe correction taking it from 91.80 on 12/1 to 88.06 on 12/28, breaking the rising support line shown above in light blue (click on chart to enlarge).
Is the bullish case compromised? Tough to say. I personally exited my remaining long position yesterday 12/29 upon confimation of that break. However, I am looking to get back in should TLT stabilize around this level or a little below and it's easy to see why on the daily chart:
the nearby 87 level should act as serious support, having repelled the previous down move (10/23) and more importantly containing the upward turning 200-day moving average (dark blue line).
Stay tuned!
December 28, 2006

An update on GLD.
Shown above is the daily chart as of December 28, 2006 (click on chart to enlarge). We are at a critical juncture and for those of us who are long, partial profit-taking is in order.
Shown above is the daily chart as of December 28, 2006 (click on chart to enlarge). We are at a critical juncture and for those of us who are long, partial profit-taking is in order.
My preferred interpretation of the technical picture is as follows:
The entire consolidation from the 5/12/2006 all-time high of 72.26 is an ABC correction as indicated on the chart. The bullish case established with the decisive break of a falling trendline on 10/30/2006 is therefore alive and well and the 12/1/2006 high at 65.55 is but an intermediate high on the way to a test of the all-time high. A break of the 65.55 high would confirm this scenario.
The entire consolidation from the 5/12/2006 all-time high of 72.26 is an ABC correction as indicated on the chart. The bullish case established with the decisive break of a falling trendline on 10/30/2006 is therefore alive and well and the 12/1/2006 high at 65.55 is but an intermediate high on the way to a test of the all-time high. A break of the 65.55 high would confirm this scenario.
I would be lacking in intellectual honesty if I didn't mention an alternative scenario also alluded to on the chart above:
In that scenario, the 12/1/2006 high would be point D of an ABCDE correction. The area I circled in red could actually be a Head and Shoulder in the making with the right shoulder being spawned at this very moment. This scenario would come into play should GLD break the 12/18/2006 low of 60.65 (incidently a hammer). Should that happen, GLD should then test support at around 55 before rebounding and resuming its bullish progression at a later time.
Stay tuned.
Stay tuned.
November 3, 2006


Ok, with a few more days under our belts since last entry, it is now safe to assume the GLD move was not a false breakout. GLD not only stayed above that resistance falling trendline but kept inching up as one can gather from studying the two charts above, respectively the daily and weekly GLD charts as of today's close.
(To have a better look at the charts, click on them twice)
On the weekly, it is also clear that the 14-day RSI bounced off the 40-50 band and crossed above both its 5- and 20-day moving averages as well as above 50. That 40-50 band is often a good spot for the RSI of a security in the midst of a bull market (as GLD most decidedly is) to bounce off and signal another leg up.
The next test and a good spot around which to take partial profits would be the previous high of 66.42 reached on 7/14/06. I wouldn't bet against that level being merely a stepping stone to bigger and better things.
October 30, 2006
 Possibly a momentous day for GLD, the gold ETF.
After months of consolidation since the all time high 72.26 reached on
5/12/06, it gapped up today above 60 and in the process broke its falling trendline (shown in light blue on the chart).
5/12/06, it gapped up today above 60 and in the process broke its falling trendline (shown in light blue on the chart).
Add to this the fact that it is right now above its 200-day Moving Average. And just to be cute, I could point out that the 14-day RSI has crossed over 55 which was a resistance of sorts.
Naturally this could be a false breakout. So we'll have to see what happens in the next few days.
But all in all not a bad spot to start nibbling at gold or slightly increase one's gold exposure.
Click twice on the chart above to enlarge.
September 25, 2006
9/25/2006
I finally have an update for the TLT trade/analyis. The conclusion first: take partial profits. Which in my case means get out of the position on Tradestation (short-term horizon) but not on Schwab (longer-term).
Here’s the daily chart:
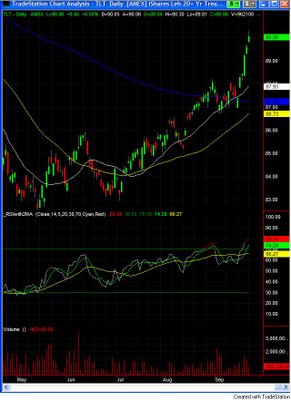
(Click twice on the chart to enlarge)
It looks like an exhaustion gap. The RSI is at 80. And finally 90 is previous resistance dating back to 02/14/2006 (shown in the weekly).
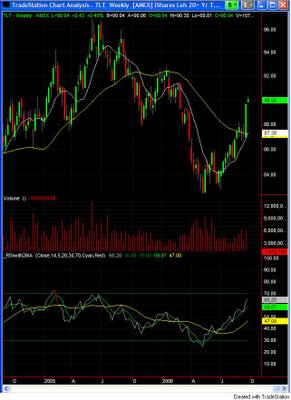
Longer term, as you can see in the following chart, the potential for further gains is still there, with the RSI still rising and not yet overbought. If the 90-92 resistance band is overcome, further upside to 96 is possible.
Here’s the weekly chart:
I finally have an update for the TLT trade/analyis. The conclusion first: take partial profits. Which in my case means get out of the position on Tradestation (short-term horizon) but not on Schwab (longer-term).
Here’s the daily chart:

(Click twice on the chart to enlarge)
It looks like an exhaustion gap. The RSI is at 80. And finally 90 is previous resistance dating back to 02/14/2006 (shown in the weekly).
Longer term, as you can see in the following chart, the potential for further gains is still there, with the RSI still rising and not yet overbought. If the 90-92 resistance band is overcome, further upside to 96 is possible.
Here’s the weekly chart:

Subscribe to:
Posts (Atom)